

Graphic User Interface
The QuRapID-XF’s integrated. intuitive, powerful and user-friendly software helps simplify and automate the qPCR process.
- Designed for use by both specialist and non-specialist personnel
- Multiple hierarchical and configurable user profiles for complete control and security accessed via a secure log in procedure
- Real time tracking and reporting of the qPCR process
- Seamless graphics and easy-to-follow visuals display relevant data and results
- Intuitive, simple and qualified results reporting for non-technical users via the pre-calibrated traffic light system which interprets results as either ‘Positive’, ‘Negative’ or ‘Repeat’
- Independent control and input selection for each of the instruments wells
- Individual and unique 2D data matrix barcodes to ensure complete traceability and continuity when processing sample data
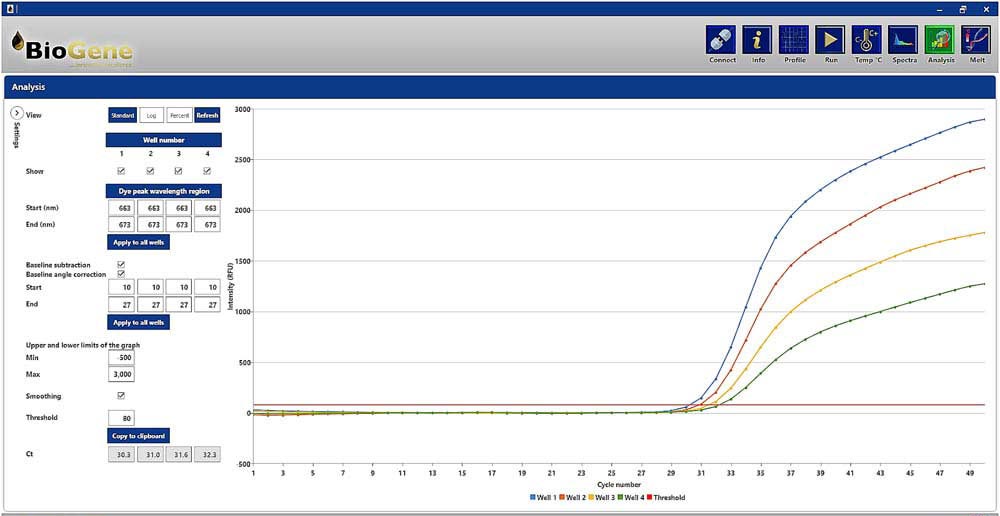
Sensitive detection at a range of different blood percentages. PCR curves shown on a linear graph
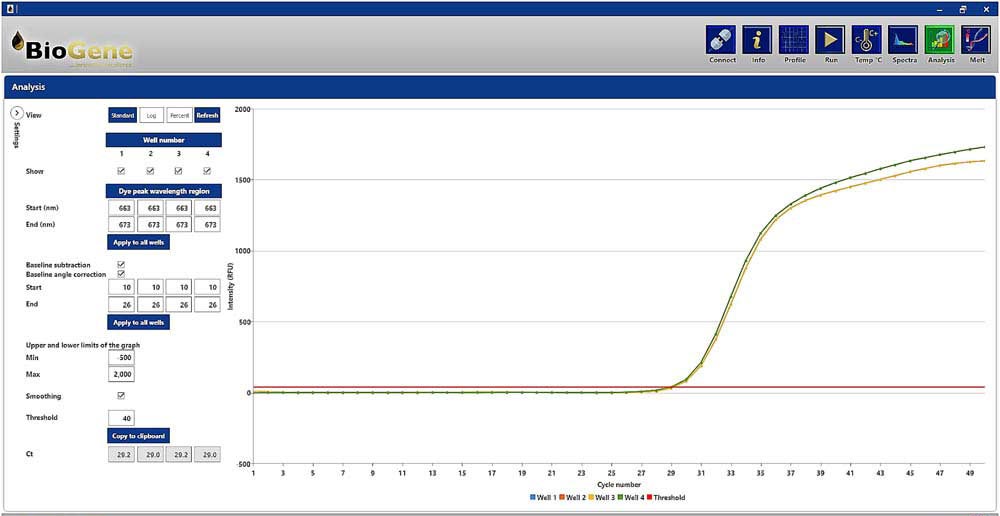
Excellent repeatability between runs. PCR curves shown on a linear graph
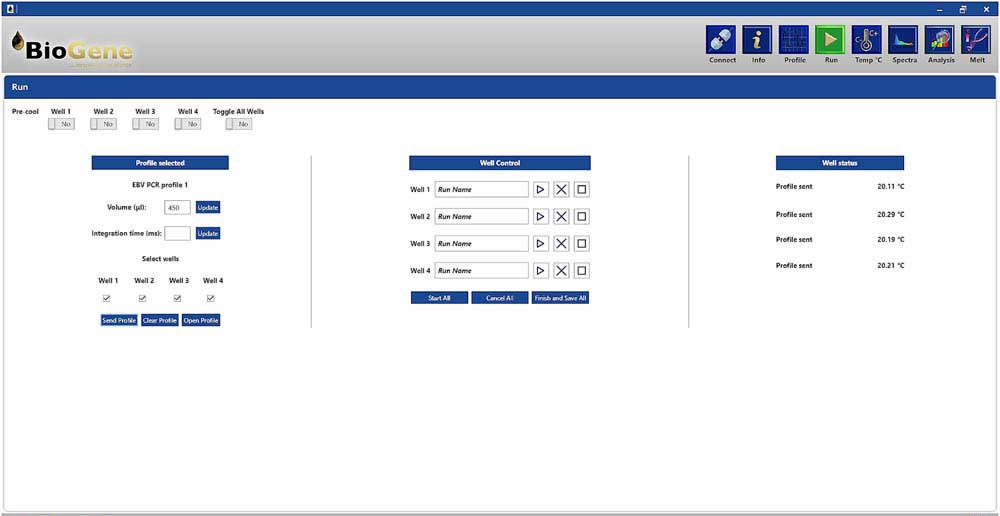
Simple layout allows easy PCR profile loading and individual control of each well
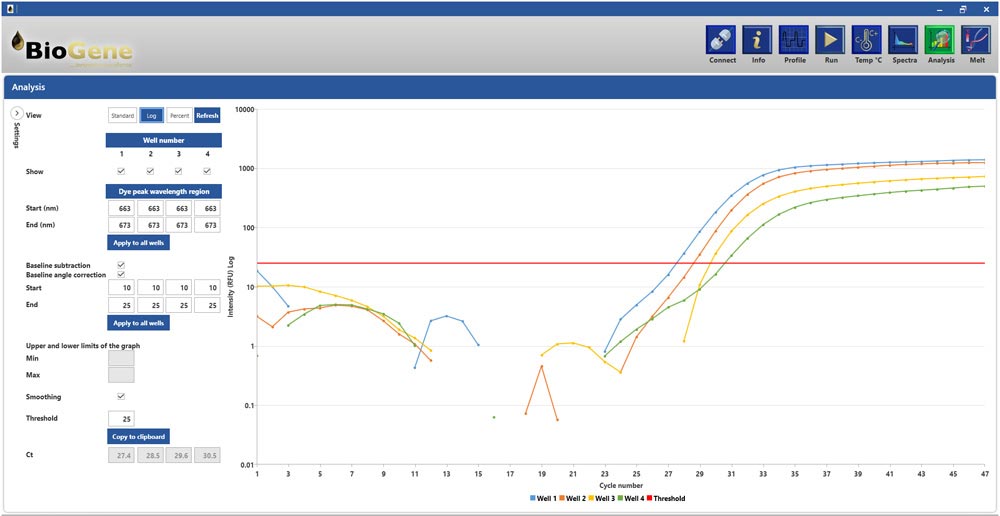
Accurate quantitation with high sensitivity. PCR curves shown on a log graph
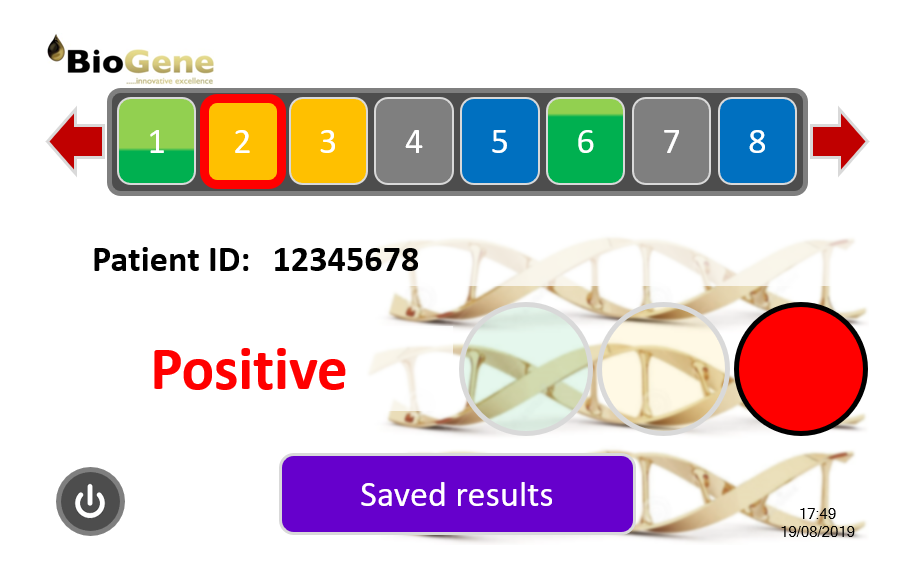
Pre-calibrated traffic light system used to define the reporting output and correlate with clinical and qPCR data

.png)